Design area charts in Adobe Express.
Represent data trends over time with an easy-to-read area chart. With the Gen Chart add-on for Adobe Express, you can transform your data into a beautiful chart and gain valuable insights quickly with AI analysis. Track trends, identify anomalies, and make predictions with this helpful add-on.

1. Launch Adobe Express.
Open Adobe Express on your desktop, then search "chart" from the add-ons panel and click “Add” to install the Gen Chart add-on for Adobe Express app, developed by INNORIA SOLUTION.
2. Input your data.
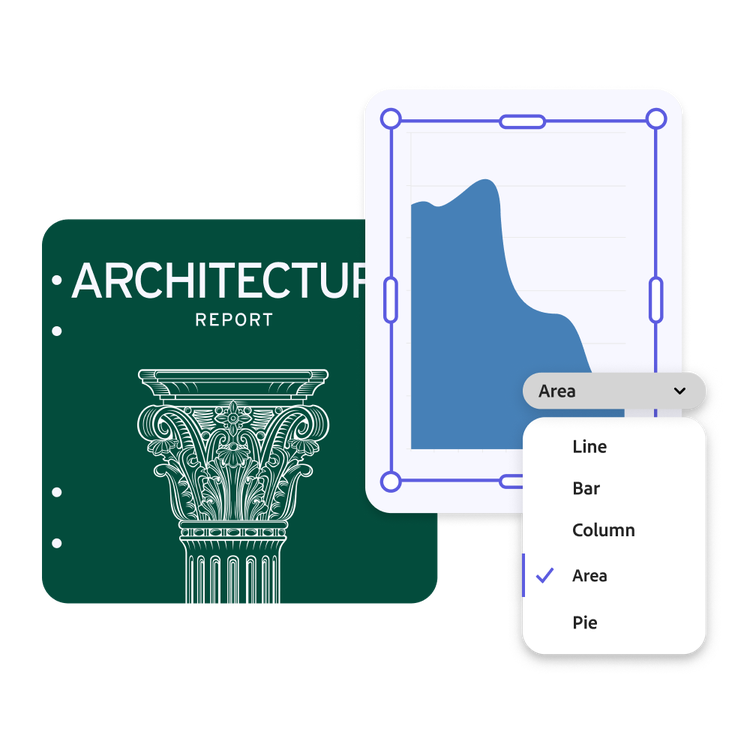
Pull your data into the add-on by hand typing your data points, linking a Google sheet URL, or other supported files (XLSX, CSV, TSV). Once your data is populated, select Area chart for Type and set your labels and values.
3. Continue editing.
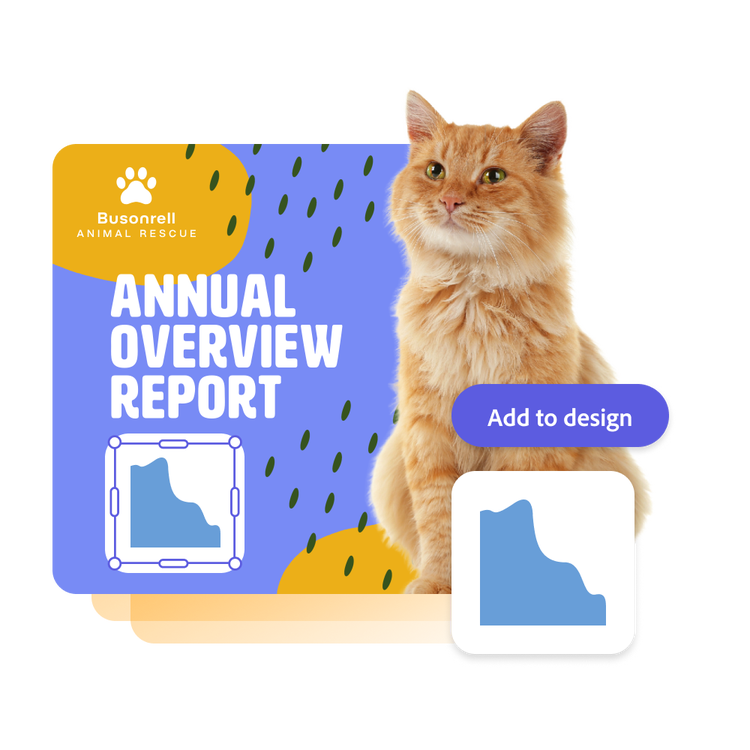
When you’ve set the parameters of your area chart, click Add to design. Then try Gen Chart’s AI analysis feature to gain insights about your data or explore more chart options.

With area charts, your data is clarified.
Organize unsightly data into an easy-to-read area chart. With the Gen Chart add-on, you can customize every aspect of your chart before adding it to your design. Click into the AI tab to see how your data can be visualized in other chart formats. Each suggestion comes with a detailed explanation of what information is highlighted and any key insights that are revealed. You don’t have to be a data whiz to impress your boss, clients, or teachers with Gen Chart and Adobe Express by your side.
Easily identify outliers and anomalies.
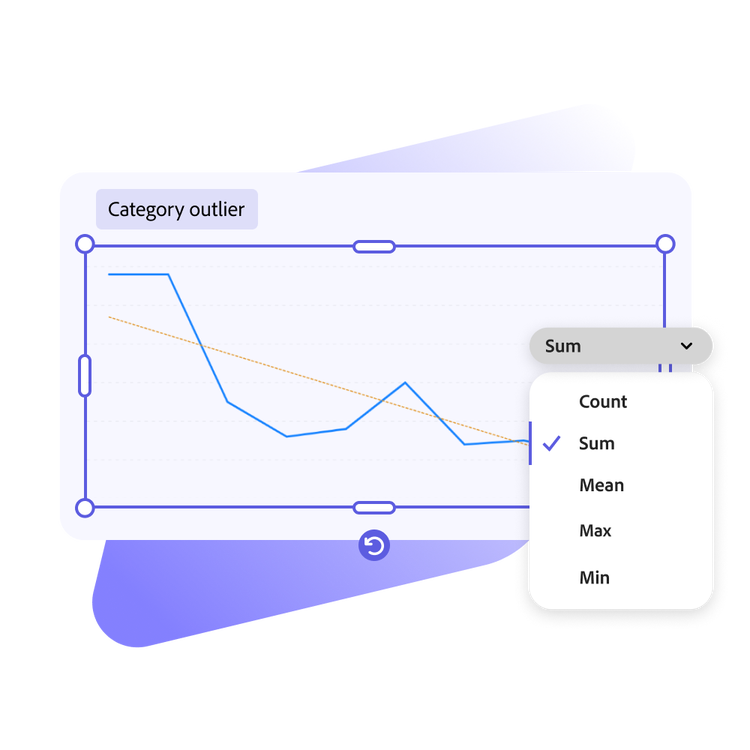
Gen Chart Insight does even more heavy lifting for you. Effortlessly identify outliers in key measurements you define, so you can confidently present more accurate data. Once outliers have been pinpointed, you can dig deeper to identify errors or explanations for large discrepancies.


Create area charts that stand out.
Making a slide deck sharing your research on shifting consumer demographics or a social media post that shows how many animals your rescue has taken in over the years? You want a chart that will draw your audience’s attention. Enhance your area chart in the Adobe Express editor by adding images, graphics, animations, and more in just a few clicks.